Making Watch Lists Work for You

Published December 30th, 2021
Making watch lists work for you? How to use watchlists to spot opportunities?
Easy.
The watchlists provide a short list of high momentum stocks, both bullish and bearish, that are potentially continuing within strong trends or pulling higher out of basing patterns or falling from distribution areas.
In conjunction with these watchlists one can use various discretionary chart patterns to identify low risk opportunities. Unlike the Premium Portfolio service these patterns cannot be programmed into a computer. However, by using correct trading principles one is able to create an edge over the longer term. Being discretionary allows a trader to adapt to market conditions and trade in both bull and bear markets.
Some History
You may have read the book or even heard the intriguing story about a young ballroom dancer named Nicolas Darvas who traded $25,000 into $2 million dollars in 18 months by using the stock market. In today’s terms that would be worth well over $20 million!
Even though this book, How I Made 2,000,000 in the Stock Market, was written back in the 60’s the simple principles and techniques remain valid today – and they continue to be used successfully.
There is no secret here and there is certainly no need to pay thousands of dollars for this information. Darvas identified a naturally occurring pattern caused by normal human emotion. He then followed along, riding the trends, repeating the process, and making millions of dollars doing so.
Using watchlists cuts through the noise to find high momentum stocks and ride the same pattern as Darvas did over 50 years ago.
If there is any secret to this method it would be: cut your losses and let your profits run. This principle has been profitable for decades and continues to be so today. This was fully discussed in our recent article How Profits Are Generated.
My Own “AH-HA” Moment That Took 18,000 Hours
Back in the late 80’s and early 90’s, well before I’d heard of Nicolas Darvas, I had been tinkering with basic trading techniques, namely moving average crossovers. But one day I came across a book called Pattern Probability Strategy (PPS Trading System) by Curtis Arnold^ and I had my very own ‘light bulb’ moment.
His methods resonated and made complete sense.
Like Darvas, Arnold explored a variety of low risk chart patterns but then he mathematically tested them over an extended period of time whilst compiling extensive data on the performance of each. For the following 18 months I spent over 2 hours a day, 7 days a week, taking each of his patterns and tested them manually across global futures markets. I’ve continually tested the strategy ever since. Doing this by hand allowed me to define certain traits and characteristics of each, as well as refining entries and exits to suit my own personality.
Here’s a simple weekly routine I like to follow:
(1) I review the stocks on the watchlists,
(2) I align them with the broader market trend, then
(3) Find low risk opportunities in the direction of the prevailing trend.
Here’s a list of patterns from my own Playbook:
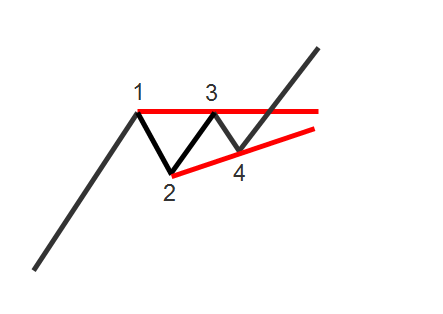
Ascending Triangle
This is a continuation pattern and can be found in both bullish and bearish markets. Whilst not as strong as the Ascending or Descending patterns it can still be very useful during strong trends. Recognised by its coiling action and ideally declining volume.
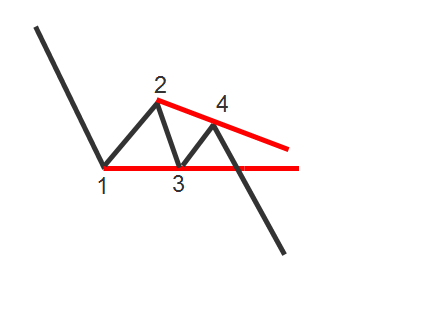
Descending Triangle
Opposite to the Ascending Triangle, this Descending Triangle is a bearish continuation pattern best traded during strong down trends. It is recognised by its flat bottom and four internal swing points. Volume should decline during its construction.
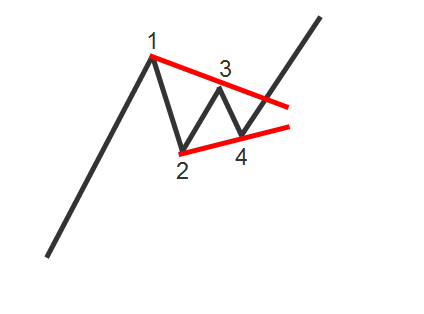
Symmetrical Triangle
This is a continuation pattern and can be found in both bullish and bearish markets. Whilst not as strong as the Ascending or Descending patterns it can still be very useful during strong trends. Recognised by its coiling action and ideally declining volume.
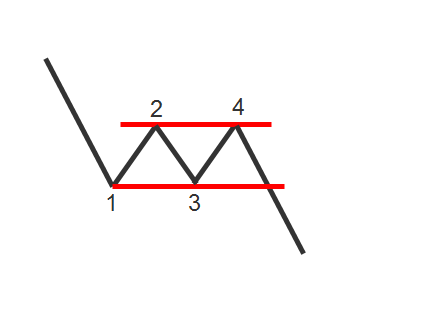
Rectangle (Darvas Box)
Found in both bullish and bearish markets and recognised by its parallel upper and lower boundaries. This is a continuation pattern and ideally should be traded in the direction of the prevailing trend although can be traded against. Volume should contract during construction.
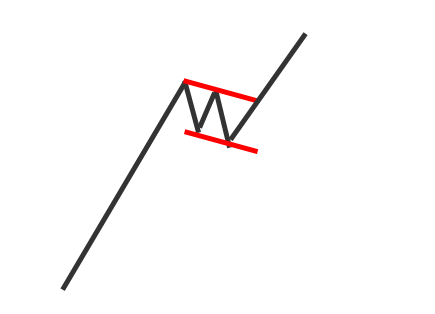
High Tight Flag
Quite possibly the most powerful continuation pattern and certainly should be included in ones trading arsenal. This is a very tiny pause in a very strong trend. Ideally price action leading into the pattern should be impulsive with limited dips. Can last under 5 days.
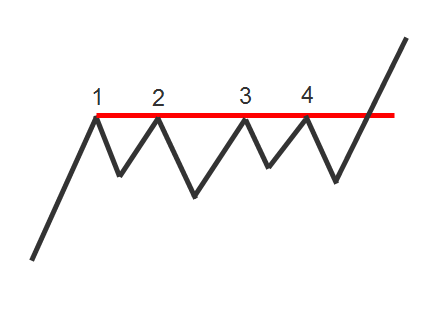
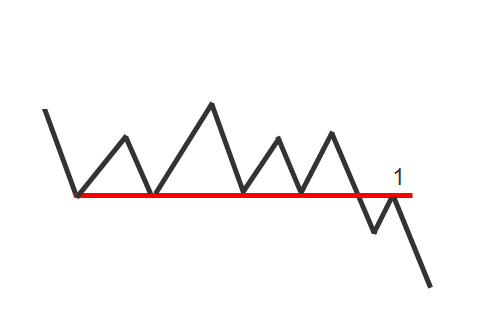
Resistance Line
Usually located in an uptrend, although not necessarily in a strong market environment. Recognised by a distinctive horizontal barrier that is touched on a minimum of 3 occasions. The more the barrier is touched the strong the prevailing breakout will usually be.
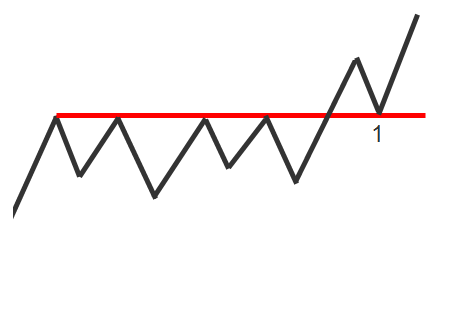
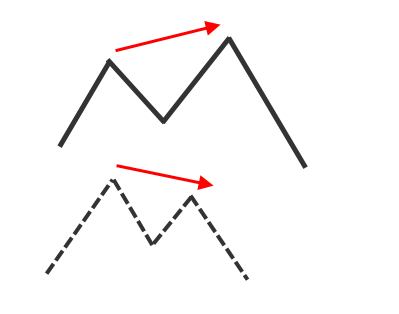
Resistance Line Retest
On many occasions after a strong line of resistance is broken price will return to the breakout level. This is known as a retest and can offer a new entry point and on many occasions, one with very low risk. A common setup for professional traders.
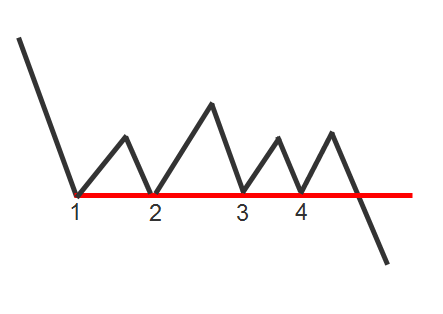
Support Line
Usually located in a downtrend, although not necessarily in a strong market environment. Recognised by a minimum of 3 touches of a horizontal barrier below prevailing prices. Can also be seen after sustained uptrend as part of a trend reversal formation.
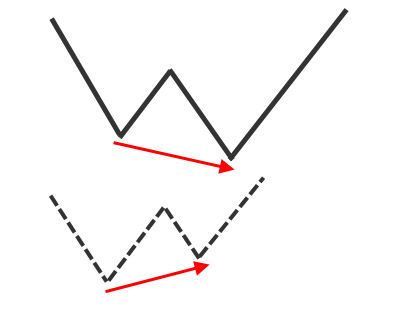
Support Line Retest
A powerful pattern in bearish market environments is a retest of an old support line after an initial breakdown. Many investors look to buy the dip and can briefly force a minor reaction against the trend. A perfect trap.
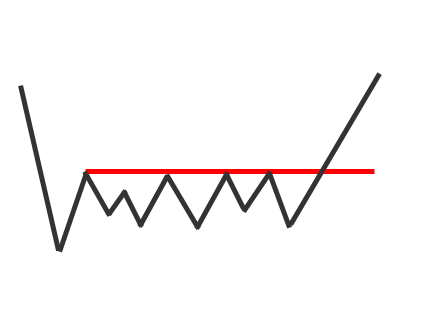
Base Breakout
After a long down trend or sudden capitulation, a stock may move sideways for an extended period of time as sellers finally get bored and exit. However, the stock is being accumulated and will rise once sellers exit.
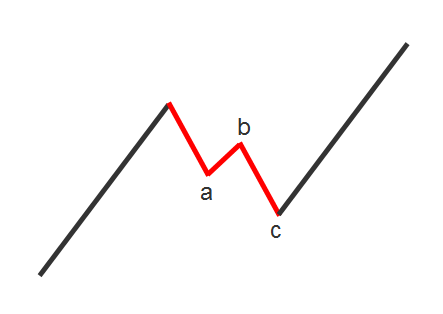
A-B-C or Zig-Zag
A common pattern in both up and down trends. A distinctive 3-wave pause in trend where the distances of both -a and -c are of similar length and symmetry. Low volume is ideal during the pattern and best traded using a profit target set at 2% above/below the start of the pattern.
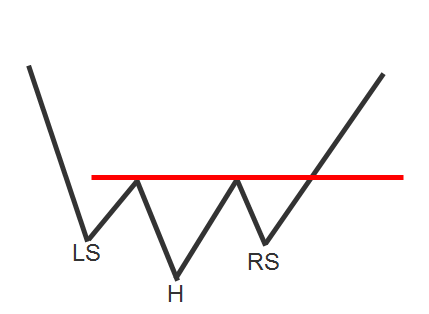
Head & Shoulders Bottom
A worthy pattern to pursue and one that is preceded by a sustained down trend. Recognised by 3 distinct troughs of which the middle is lower than the outside two. Ideally volume into the LS should be high and then declining into the other troughs, especially the RS.
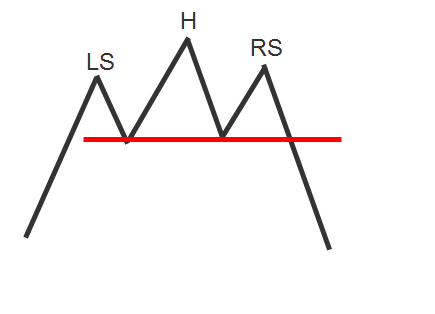
Head & Shoulders Top
A common topping pattern following on from a sustained uptrend. Recognised by 3 distinct peaks of which the middle peak is higher than the outside two. Can be a sign of distribution and start of a new trend lower. Can offer various entry points.
Type-A Bullish Divergence
There are 3 types of divergences but the Type-A is, in our view, the strongest. It is also the only pattern that uses a corresponding indicator. Price action makes two lows of which the second low is below the first. The indicator makes two lows but the second is higher than the first.
Type-A Bearish Divergence
This is a bearish reversal pattern whereby price makes two peaks, the second of which is higher than the first. The indicator makes two peaks, of which the second is lower than the first. The opposing peaks create the divergence that operates like a rubber band.
Falling Wedge
A bullish pattern found in a strong uptrend. It is seen as a weak attempt at a selloff but is usually on low volume and presents choppy price action. Differs from a flag as it tends toward an extra internal price swing and it coils inward.
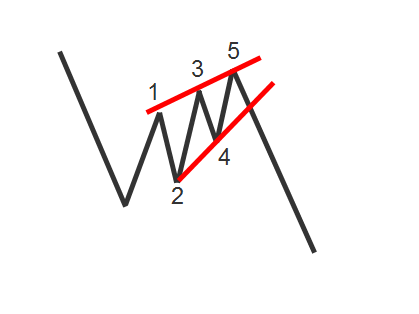
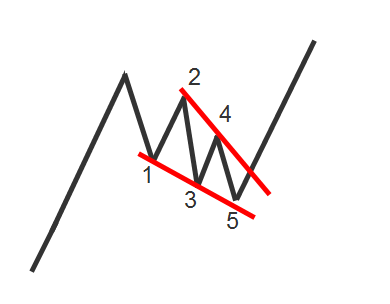
Rising Wedge
A bearish pattern found in a downtrend. This is a weak attempt at the stock to bounce and is best identified by 5 internal swings in a choppy, coiling action. Pattern becomes more powerful when volume is low
^ Whilst Curtis Arnold was fined and banned from the securities industry for false and misleading representations, the context of these patterns remain valid.
